
목록분류 전체보기 (305)
UOMOP

 Multiple Regression(다중 회귀) - 릿지/라쏘
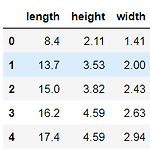
import pandas as pd import numpy as np from sklearn.model_selection import train_test_split from sklearn.linear_model import LinearRegression df = pd.read_csv("https://bit.ly/perch_csv") df.head() perch_all = df.to_numpy() print(perch_all.shape) (56, 3) perch_weight = np.array( [5.9, 32.0, 40.0, 51.5, 70.0, 100.0, 78.0, 80.0, 85.0, 85.0, 110.0, 115.0, 125.0, 130.0, 120.0, 120.0, 130.0, 135.0, 11..
 Linear Regression(선형 회귀)
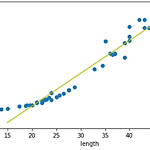
from sklearn.linear_model import LinearRegression lr = LinearRegression() lr.fit(train_input, train_target) lr.predict([[50]]) array([1241.83860323]) 선형 회귀 모델을 호출하고, 이 모델을 통해 훈련을 시켜 50cm의 농어의 무게를 예측해본 결과, 1241.84g가 출력되었다. k-최근접 이웃 회귀 모델보다는 더 이상적인 결과가 나왔음을 확인할 수 있다. print("기울기 : {}\ny절편 : {}".format(lr.coef_, lr.intercept_)) 기울기 : [39.01714496] y절편 : -709.0186449535477 선형 회귀 모델에서는 lr.coef_에 기울기가 ..
 k-최근접 이웃 model의 문제점
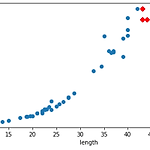
k-최근접 이웃 모델에는 한가지 대표적인 문제점이 있다. import numpy as np import matplotlib.pyplot as plt from sklearn.metrics import mean_absolute_error from sklearn.neighbors import KNeighborsRegressor from sklearn.model_selection import train_test_split perch_length = np.array( [8.4, 13.7, 15.0, 16.2, 17.4, 18.0, 18.7, 19.0, 19.6, 20.0, 21.0, 21.0, 21.0, 21.3, 22.0, 22.0, 22.0, 22.0, 22.0, 22.5, 22.5, 22.7, 23.0, 2..
 농어(perch) 무게 예측 using "k-최근접 이웃 회귀"
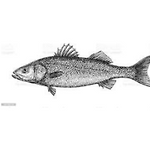
지도 학습에는 분류(Classify), 회귀(Regress)가 있다, "분류"는 종류를 분류하는 것이고, 예를 들어서 도미와 빙어의 데이터로 학습을 한 후에, 새로운 샘플에 대해서 도미인지 빙어인지 확인하는 실습이 있었다. "회귀"는 임의의 숫자를 예측하는 것이고, 예를 들어 데이터를 통해서 학습을 한 후에, 새로운 샘플에 대해서 임의의 특징에 대한 값을 예측하는 실습이 있다. k-최근접 이웃 k-최근접 이웃 분류는 실험 샘플의 주변 중 더 많은 target으로 분류시키는 과정이었다면 k-최근점 이웃 회귀는 실험 샘플의 주변의 데이터를 평균을 내어 target값을 예측한다. 1. 농어의 길이, 무게 데이터를 가져오고 각종 module을 호출 import numpy as np import matplotli..
 전처리 과정 中 Scaling의 중요성
1. 데이터를 가지고 와서 input data, target data로 분류 import numpy as np bream_length = [25.4, 26.3, 26.5, 29.0, 29.0, 29.7, 29.7, 30.0, 30.0, 30.7, 31.0, 31.0, 31.5, 32.0, 32.0, 32.0, 33.0, 33.0, 33.5, 33.5, 34.0, 34.0, 34.5, 35.0, 35.0, 35.0, 35.0, 36.0, 36.0, 37.0, 38.5, 38.5, 39.5, 41.0, 41.0] bream_weight = [242.0, 290.0, 340.0, 363.0, 430.0, 450.0, 500.0, 390.0, 450.0, 500.0, 475.0, 500.0, 500.0, 340..